- Organizational Load Index (OLI): OLI is calculated as the total amount of time any given employee consumes from the rest of the organization based on meetings they schedule and emails they send out. For example, if Ed schedules a one-hour meeting with four people, he has consumed four hours of time from the organization. OLI helps employees and executives alike understand to what extent they are consuming an organization’s time through scheduled meetings and emails sent. This metric has made me re-think hitting “reply all” and inviting people whose presence is not critical to a meeting.
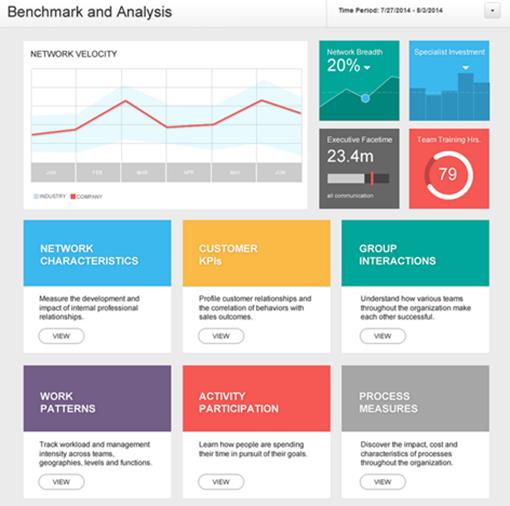
- Number of people in cross-collaboration: This metric can be dynamically calculated for any set of two groups within the company. It is based on the number of unique individuals who participated in email communication or attended a meeting involving anyone from the two groups in question. This metric provides unparalleled insight into which teams are collaborating and the frequency and duration of the collaboration. Ineffective or infrequent collaboration across company teams can stifle innovation, growth, and employee engagement.
- Time Fragmentation: Time Fragmentation measures the extent to which meetings fragment the working time of employees. It is calculated as the number of two-hour blocks with no calendared meetings available during normal employee working hours (e.g., if your standard working hours are 8 a.m.-5 p.m. and you have a one-hour meeting at 10 a.m. and a two-hour meeting at 2 p.m., then you would have two two-hour blocks of time available). Research suggests that it takes people at least 15 minutes to regain focus after an interruption, and employees find it difficult to refocus when there is less than an hour until their next meeting. By understanding time fragmentation data, managers can schedule meetings strategically, so employees have significant blocks of uninterrupted time each day to focus on their actual work.
In addition to these metrics, which provide actionable insights into a company’s organizational health and productivity, VoloMetrix’s technology can predict sales-quota attainment, attrition, performance, and more. VoloMetrix unearthed that internal networking is strongly correlated with sales-quota attainment. By gathering data on employees’ internal networking, VoloMetrix can predict employees’ quota attainment with a high degree of accuracy, as early as one month into the quarter. VoloMetrix’s technology truly is at the forefront of people analytics, an emerging big-data category.
For the full release, please visit MarketWired. VoloMetrix’s announcement also spurred some compelling coverage in key outlets.
- CIO – Is Big Data watching you at the water cooler?—August 22, 2014
- PC Advisor – Is Big Data watching you at the water cooler?—August 22, 2014
- ARN – Is Big Data watching you at the water cooler?—August 22, 2014
- BankITAsia—Is Big Data watching you at the watercooler?—August 25, 2014
- Forbes—Volometrix Attempts To Measure Employee Productivity–But Is It A Flawed Model?—August 27, 2014
- ITBusiness.ca—How productive are your employees? VoloMetrix can give you the numbers—August 27, 2014
- Datanami—Are Meetings a Waste of Time? Data Analytics Weights In—August 26, 2014
- Contact Center Analytics Review—VoloMetrix Files Patent, Featured in Harvard Business Review—August 27, 2014
- News.Now.Co–NEWS: VOLOMETRIX FILES PATENT FOR GROUND-BREAKING PREDICTIVE PEOPLE ANALYTICS SOFTWARE—August 27, 2014
- Software Industry Today—VoloMetrix Files Patent for Ground-Breaking Predictive People Analytics Software—August 27, 2014
As Chantrelle Nielsen, head of customer solutions at VoloMetrix, shared with Datanami, “In a lot of companies, you have to submit a receipt and an expense code for a cup of coffee you bought for somebody. But you don’t have to submit anything and there’s no approval process and no real judgment on whether you’re spending $5,000 worth of people’s time in a meeting that lasts all afternoon.” We are excited to help VoloMetrix change that.